Datadog's State of AI Engineering report puts a number on something most teams only feel: around 5% of AI model requests fail in production, and nearly 60% of those failures come from capacity limits. The headline conclusion is that operational complexity, not model intelligence, has become the barrier.
I had spent an afternoon measuring a free inference endpoint shortly before reading it, so I went back to my own numbers expecting to confirm the finding.
Nothing had failed. Not one request.
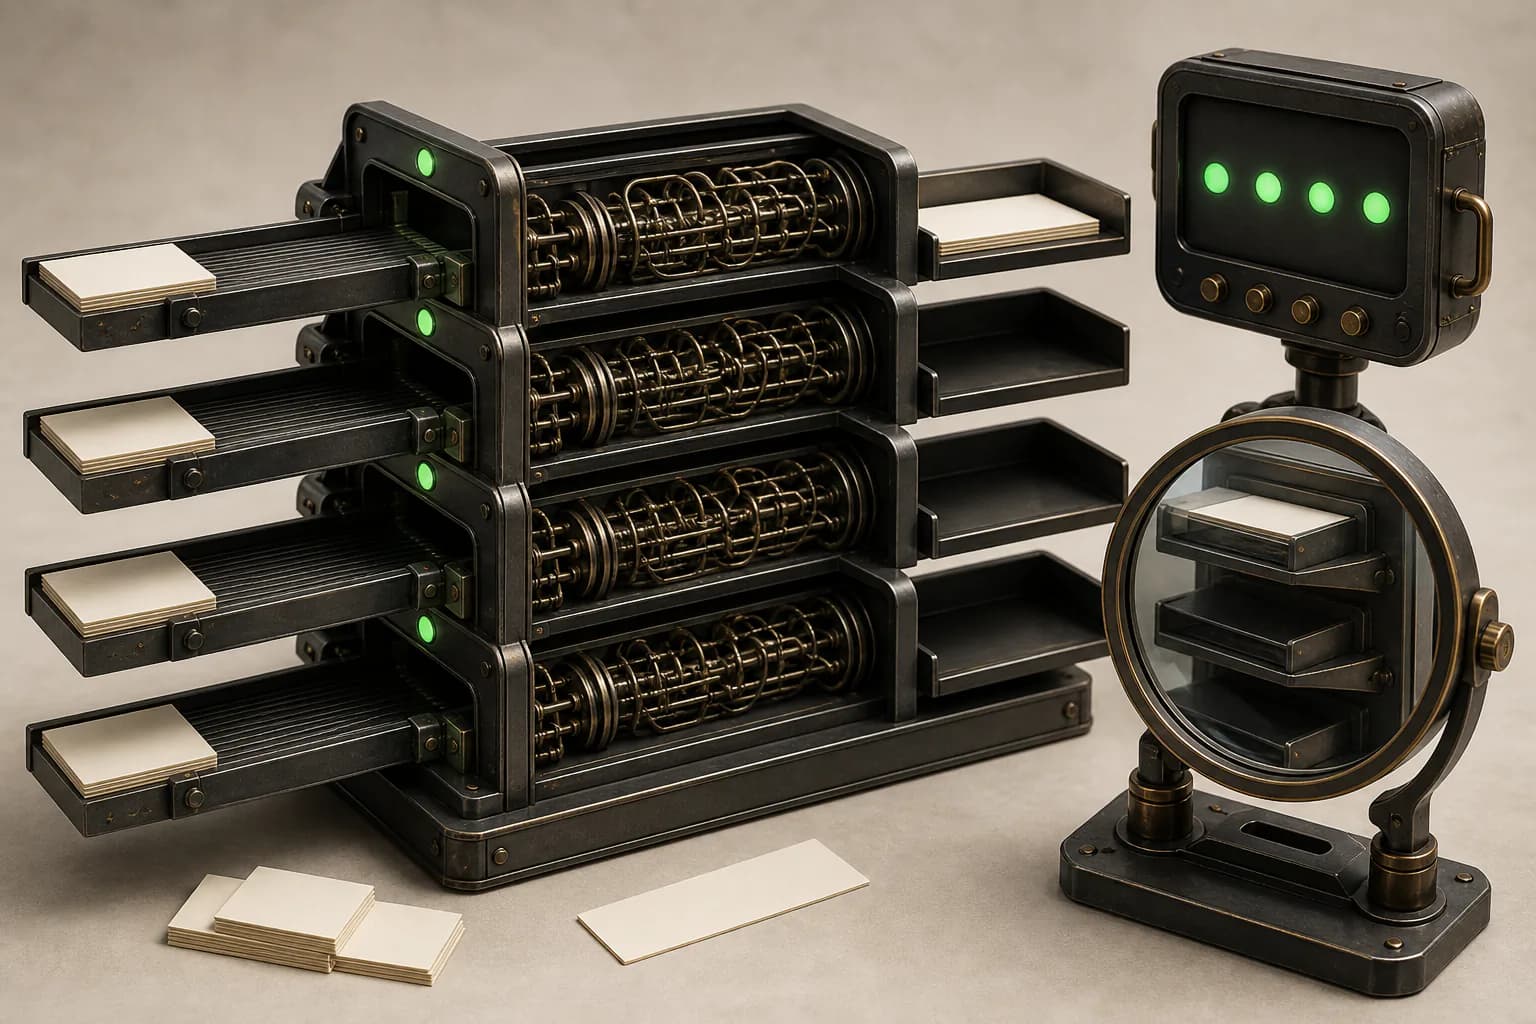
Zero failures, and mostly useless answers
The endpoint was Hetzner's experimental inference API, four open-weight models, free, no SLA. Across the whole benchmark I spent 17,920 output tokens against a limit of 200,000 a minute. Nothing returned a 429. Nothing errored. By the metric in the report, this was a flawless run.
It was also nearly worthless, and here is why. Given a 512-token budget, three of the four models produced exactly 512 completion tokens and zero visible words:
Qwen 3.6       512 tokens    0 words
DeepSeek V4    512 tokens    0 words
GLM 5.2        512 tokens    0 words
Kimi K2.7      512 tokens    an answer
They spent the entire budget reasoning and were cut off before the answer began. Status 200. Tokens billed. Latency recorded. Nothing to show a user.
A failure rate cannot see this. The request succeeded on every axis a monitor watches, and the only thing wrong with it is the part no status code carries.
What else the rate misses
Reading my own measurements against the report's categories, three more modes turn up that a percentage of failed requests will not surface.
- Latency that is not a number but a range. GLM 5.2's time to first token ran from 11 to 173 seconds across five runs. A median of 26.8 seconds is technically correct and operationally meaningless: the p50 tells you nothing about the run that made someone close the tab.
- Generations that stop on their own. Raised to a 4,096-token budget, every model terminated somewhere between 1,046 and 2,680 tokens. The larger budget bought a slower request and nothing else. Both the small budget and the large one succeed; only one of them is spending anything usefully.
- Concurrency that helps one model and hurts another. Eight parallel 256-token requests left Qwen 3.6 at roughly 36 tokens per second per request, against 34 for a lone one. The same treatment dropped DeepSeek V4 to 15. Same infrastructure, same load, opposite behaviour, and no errors in either column.
Where the report is right, from ten requests
The capacity mode the report describes is real, and I met it head on somewhere else.
A stealth preview model appeared on OpenRouter for about a week, free while it lasted, and while I was using it to build something, 4 of 10 requests timed out.
That is exactly the failure Datadog counts, and it is also a number I want to be careful with. Ten requests is a tiny sample, and I was not running an experiment, I was working. The 95% interval around 4 of 10 runs from 17% to 69%, which is another way of saying it tells you the phenomenon was present and almost nothing about its size. What it will not support is any comparison with the report's 5%.
The mechanism is not in dispute though, and it is the ordinary one: a free preview under sudden attention has no capacity headroom, and the first thing that gives is the tail of the latency distribution.
What I would measure instead
A failure rate is a good top-line number and a poor working one. Four things I would put beside it, all of which I only have because I measured rather than monitored:
- Empty-answer rate. What fraction of successful responses contain no usable output. On that free endpoint it was three of four models at the default budget, which is a far more useful figure than the zero percent failure rate sitting next to it.
- Budget efficiency. Completion tokens spent against visible words produced. It is the number that tells you a reasoning model is thinking on your bill.
- Tail latency, stated as a range. Not a median. The spread between 11 and 173 seconds is the product decision, and the median hides it.
- Per-model behaviour under concurrency. Measured per model, not per provider, because two models on the same infrastructure behaved oppositely.
Next
None of this contradicts the report. Operational complexity really is the barrier, and I would guess the 5% is well founded across the population it was drawn from. My argument is narrower: the metric is drawn from the layer where requests either complete or do not, and a growing share of what goes wrong with inference completes.
Two of the four models I measured have since been withdrawn from that endpoint, which quietly removes the counter-example and the most volatile number in the piece. That is its own lesson about measuring free capacity.
The measurement underneath this is the Hetzner run where the models spent their free capacity thinking. Three of the four have since been withdrawn from that endpoint, so these numbers are a snapshot and nobody can reproduce them, including me.
If you run inference in production, the number I would ask you for is not your failure rate. It is what fraction of your successful responses a user would have called an answer. If you have never separated those two, you do not yet know which of them is your problem.
Report figures are from Datadog’s State of AI Engineering, published 21 April 2026. The inference numbers are my own measurements. The 4-of-10 timeout count is an observation from working, not an experiment, and is treated as such in the text.
Building something similar?
I write about setups I actually use. If you're working on something comparable, I'd be curious what your workflow looks like.